
How We Got a 100-Tool React App to a 307 KB Main Bundle (From 6 MB)
2026-05-25
The Vite build output had been telling us this for months:
(!) Some chunks are larger than 500 kB after minification.
We had ignored it. The site worked fine on broadband. Background-removal AI loaded a 30 MB WebAssembly file when invoked — surely a 6 MB JavaScript bundle was small in comparison.
It wasn't.
A friend visited toolkoala.com on his Pixel phone over a flaky hotel WiFi. The Largest Contentful Paint took 2.5 seconds just on element render delay — not even counting network. The Lighthouse audit kept docking us for "render-blocking resources" and "reduce unused JavaScript." Most damningly: Google Search Console had started flagging the site in Core Web Vitals reports.
So we sat down and read the build output properly.
dist/assets/index-CdRXzQJL.js 5,998 kB │ gzip: 1,755 kB
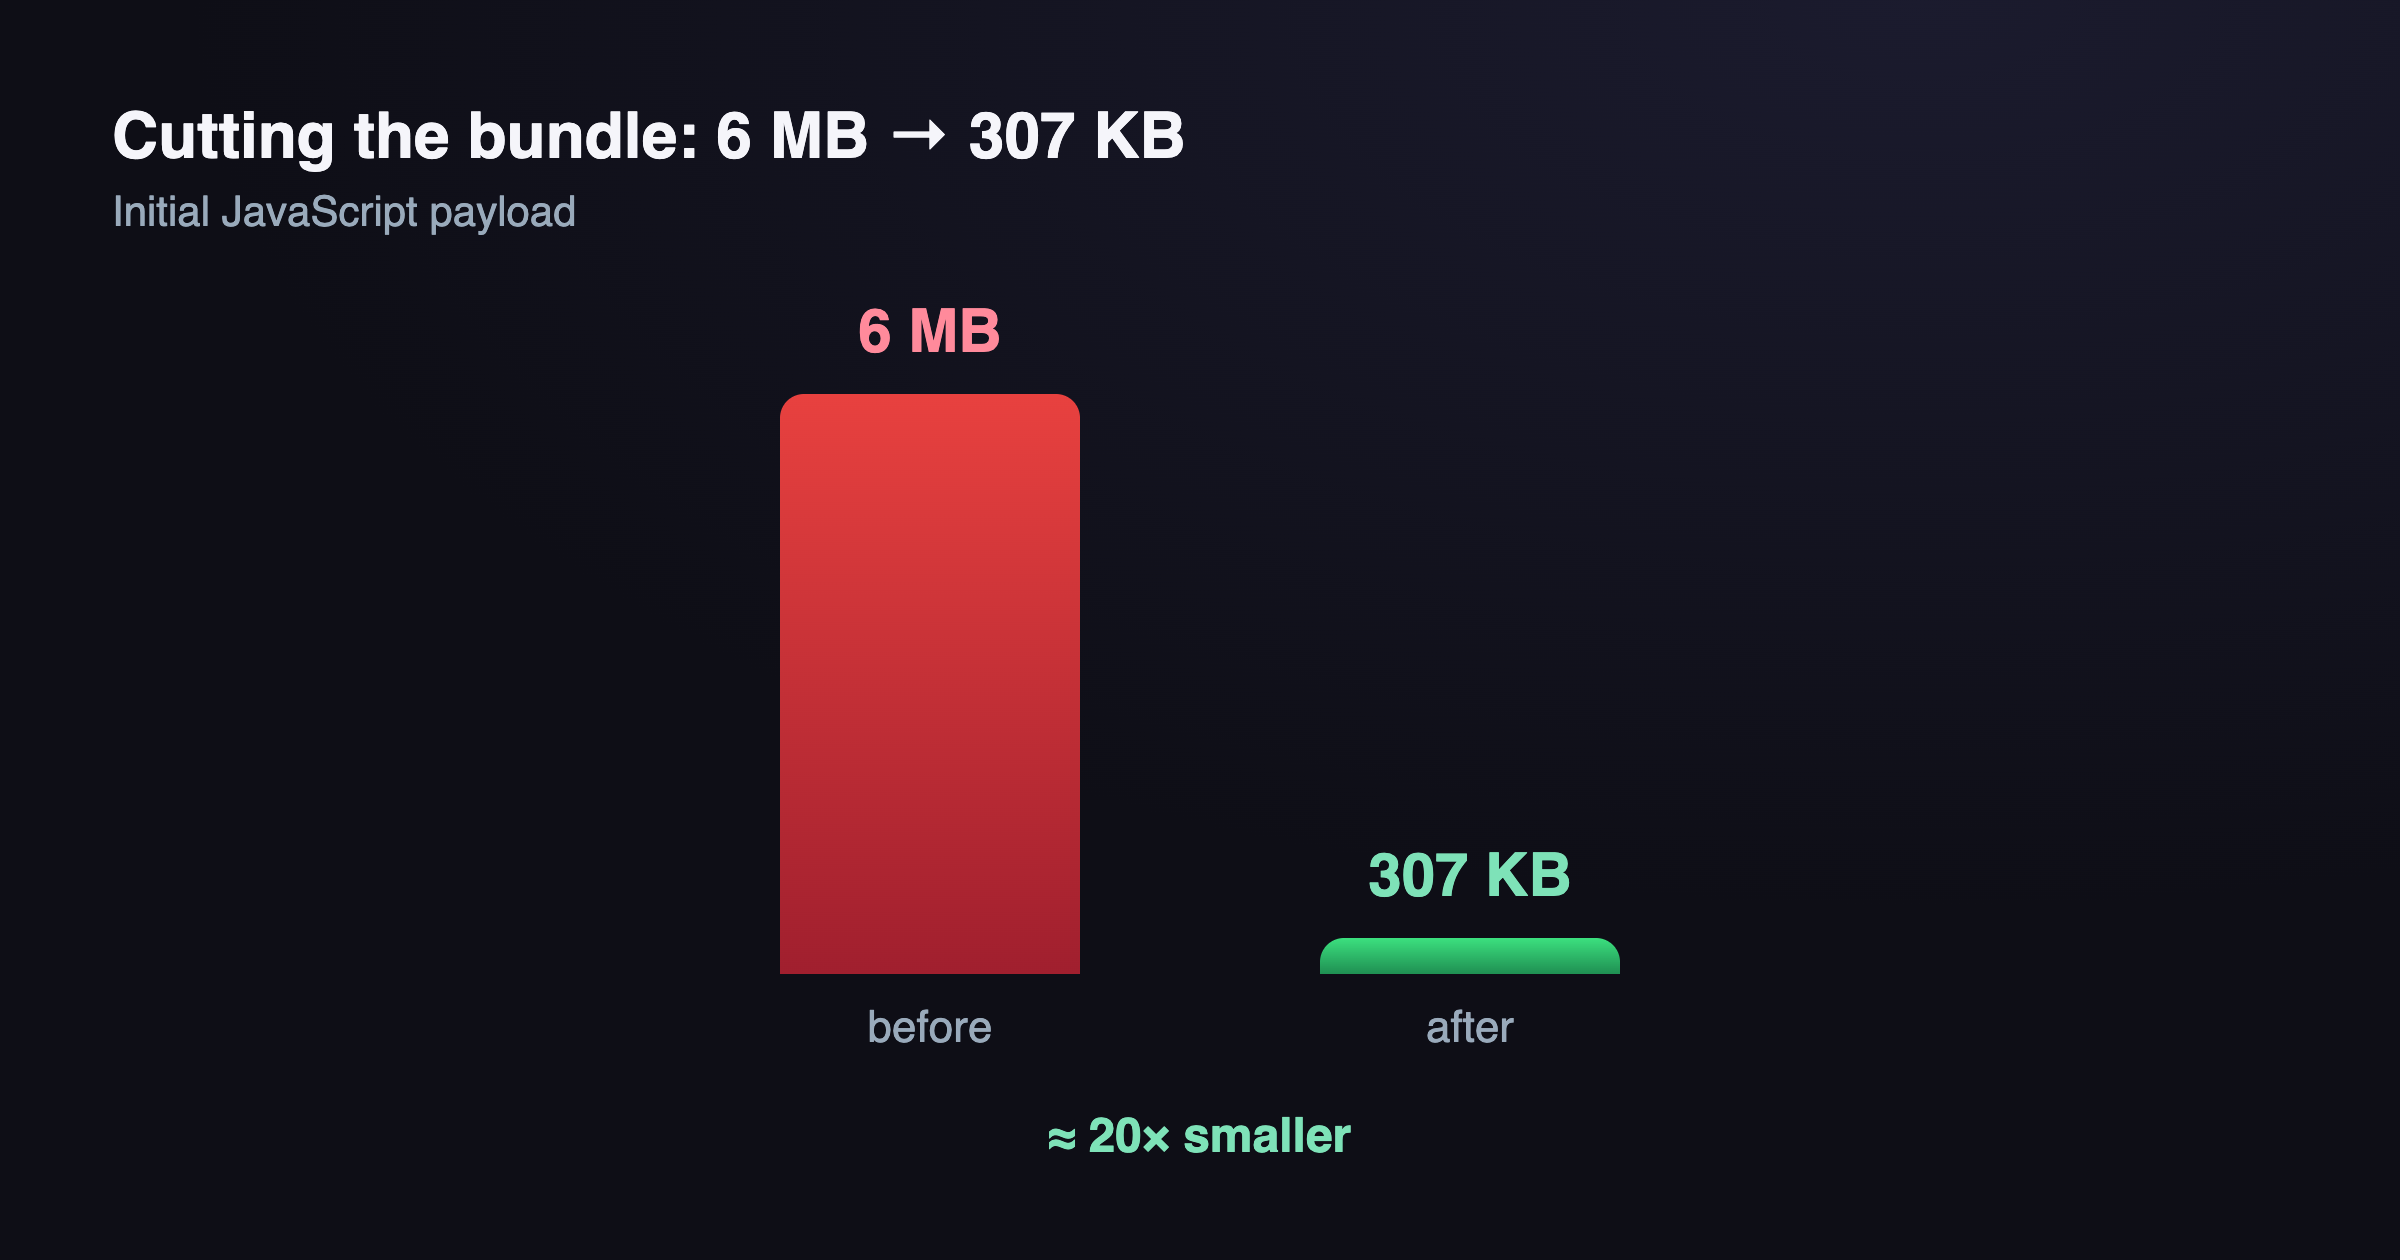
Six. Megabytes. Of JavaScript. Shipped to every visitor of the home page, before they had clicked anything.
This post is the engineering log of getting that down to 307 KB raw / 92 KB gzipped — a 95% reduction — and the LCP from ~2.5s to under 1.5s. The audit grade went from F to A. The site itself didn't change.
What was in the 6 MB
The first useful thing was running npx vite-bundle-visualizer (or just looking at the build output sorted by size). The top contributors:
- All 70+ tool components (
RemoveBackground,PdfMerge,LoremIpsum, …) - All 8 i18n locale JSON files (English + 7 translations, ~300 KB each)
pdf-lib+pdfjs-dist(a combined ~500 KB) — used by 30 PDF toolsUPNG(200 KB) — pulled in transitivelymarked,diff,jszip,pptxgen,xlsx,mammoth— each 100-500 KB
Most of these belonged to tools the user wasn't using yet. They were getting downloaded just in case the user might click on the PDF merger after looking at the lorem ipsum generator.
This is the default React pattern, and Vite happily lets you do it:
import RemoveBackground from './tools/RemoveBackground'
import PdfMerge from './tools/PdfMerge'
// … 65 more lines

<Routes>
  <Route path="/remove-background" element={<RemoveBackground />} />
  <Route path="/pdf-merge" element={<PdfMerge />} />
  // …
</Routes>
Every import statement says "ship this code on every page." That's how 70 tools become one 6 MB bundle.
Fix 1: Route-level code splitting (saves ~5.7 MB)
The standard React fix for this is React.lazy() plus Suspense. Vite's already-configured rollup-based bundler will automatically emit one chunk per dynamic import.
We converted every tool import:
const RemoveBackground = lazy(() => import('./tools/RemoveBackground'))
const PdfMerge = lazy(() => import('./tools/PdfMerge'))
// …
Then wrapped the routes:
<Suspense fallback={<div className="loading">Loading…</div>}>
  <Routes>
    <Route path="/" element={<Home />} />
    <Route path="/remove-background" element={<RemoveBackground />} />
    // …
  </Routes>
</Suspense>
We left Home and Nav eagerly imported. The home page is the most common landing, and the nav has to render immediately on every page anyway.
After this single change: main bundle dropped from 5,998 KB → 3,025 KB. Each tool became its own chunk: 3-50 KB each, fetched on demand when the user navigates.
The trade-off: visiting a tool for the first time now requires one extra network round-trip to fetch that tool's chunk. But the chunks are small (often single-digit KB gzipped), and modern HTTP/2 amortizes the round-trip cost across multiple parallel requests. On real-world connections, the latency increase is invisible.
The win is on the first page load — the one that matters for Largest Contentful Paint and for first-time visitor bounce rate. We had cut it by half.
Fix 2: Locale lazy-loading with import.meta.glob (saves ~2 MB)
The next bulk in the bundle was our internationalization. We support 8 languages, each with a ~300 KB JSON file containing translations for all 100+ tools' titles, FAQs, and feature descriptions. The original setup was the obvious thing:
import en from './locales/en.json'
import zhCN from './locales/zh-CN.json'
import zhTW from './locales/zh-TW.json'
import ja from './locales/ja.json'
// … 4 more

i18n.init({
  resources: {
    en: { translation: en },
    'zh-CN': { translation: zhCN },
    // …
  }
})
All eight files (~2.5 MB raw, ~700 KB gzip) inlined into the main bundle. A French speaker visiting our English home page was downloading the Korean translations.
Vite has a wonderful primitive called import.meta.glob that makes this fixable in about ten lines:
const localeLoaders = import.meta.glob('./locales/*.json')
// localeLoaders is now:
// {
//   './locales/en.json': () => import('./locales/en.json'),
//   './locales/zh-CN.json': () => import('./locales/zh-CN.json'),
//   …
// }

const initial = detectLangFromPath() || 'en'
const [enData, activeData] = await Promise.all([
  localeLoaders['./locales/en.json'](),
  initial !== 'en' ? localeLoaders[`./locales/${initial}.json`]() : null,
])

i18n.init({
  resources: {
    en: { translation: enData.default },
    [initial]: { translation: activeData?.default },
  },
  lng: initial,
})
Vite sees each import('./locales/<x>.json') call and emits a separate chunk for each locale. Only the user's current language (plus English as a fallback) loads at startup.
The fallback is small (English is loaded eagerly so missing translations in other languages don't crash). When the user switches language manually, we patch i18n.changeLanguage to fetch the new locale on demand:
const origChangeLanguage = i18n.changeLanguage.bind(i18n)
i18n.changeLanguage = async (lng) => {
  if (!i18n.hasResourceBundle(lng, 'translation')) {
    const data = await loadLocale(lng)
    i18n.addResourceBundle(lng, 'translation', data, true, true)
  }
  return origChangeLanguage(lng)
}
One gotcha: this makes i18n initialization asynchronous, so React can't render before the locale resolves. We used Vite's support for top-level await in ESM:
// main.jsx
import { initI18n } from './i18n'
await initI18n()
createRoot(...).render(<App />)
Top-level await is supported in modern browsers (Chrome 89+, Safari 15+, Firefox 89+). For older browsers Vite's build target controls polyfilling. If you need IE11 support, do this with a Suspense-based loader instead.
After this fix: main bundle 3,025 KB → 307 KB (gzip 1,755 KB → 92 KB). We had unloaded ~2.7 MB of locale data from the critical path.
Fix 3: The secondary leak — PdfToolShell (saves ~600 KB)
After the first two fixes, PageSpeed Insights still flagged "Reduce unused JavaScript" with specific culprits:
pdf-*.js— 116 KB, 96% unusedUPNG-*.js— 118 KB, 28% unused
Why were PDF libraries being loaded on the home page?
We had a shared component PdfToolShell that wraps 30+ PDF tool routes (PDF merge, split, rotate, etc.). It's not a tool itself, but a reusable shell. It was statically imported in App.jsx:
import PdfToolShell from './components/PdfToolShell'
And PdfToolShell does this at the top:
import { PDFDocument, StandardFonts, degrees, rgb } from 'pdf-lib'
import * as pdfjsLib from 'pdfjs-dist'
So the entire PDF stack was getting hoisted into the main bundle — even though the user might be visiting /lorem-ipsum.
The fix was the same lazy() treatment:
const PdfToolShell = lazy(() => import('./components/PdfToolShell'))
The lesson: lazy-loading tool components isn't enough if a shared "shell" component still statically imports their heavy dependencies. Audit every static import for what it transitively pulls in.
Fix 4: Logo (saves 640 KB)
This one is embarrassing. The site logo was a 1024×1024 PNG, 640 KB. It was displayed at 32×32 pixels in the navbar. Nobody had ever questioned it.
The fix took less time than reading this paragraph: we dropped logo.png into our own Image Compressor tool. The slider was already at 80% quality (the default). We hit Download.
The result: 6.9 KB. A 99% reduction with no visible difference at 32×32 — or even at 256×256, where we use the same logo for the Open Graph social card.
For the social-card use case (Twitter, Facebook, LinkedIn preview images), we wanted the logo to look crisp when scaled up to ~256 px. We took the original 1024×1024, dropped it into our Resize Image tool, set 256×256, ran it through Image Compress at 90% quality, and got logo-256.png at 64 KB. The og:image meta tag now points to that.
Two tools, two minutes, 633 KB saved on every page load.
If you're reading this on a phone and the logo above looks fine: that's a 6.9 KB image. The 640 KB version looked identical.
If you have a logo larger than 50 KB on your own site, the ToolKoala image compressor is right there. Drop it in, see the before/after preview, download the smaller one. Nothing gets uploaded — your logo doesn't go to our server, it processes in your browser. That's the whole point of the project, including the part where we used it on ourselves.
Fix 5: Killing the Google Fonts dependency (saves ~1.2 s LCP delay)
Our <head> looked like every web app you've ever seen:
<link rel="preconnect" href="https://fonts.googleapis.com">
<link href="https://fonts.googleapis.com/css2?family=Inter:wght@400;500;600;700;800&display=swap" rel="stylesheet">
PageSpeed reported a 1,258 ms critical-path latency from this. The browser had to:
- Resolve
fonts.googleapis.com(DNS, TLS) - Download the CSS file (returns a redirect-laden mess of
@font-faceblocks) - Resolve
fonts.gstatic.com(DNS, TLS again, different origin!) - Download the actual
.woff2file
For a utility site, Inter is nice but not necessary. We have a perfectly good CSS fallback already:
font-family: -apple-system, BlinkMacSystemFont, "Segoe UI",
             system-ui, Roboto, "Helvetica Neue", Arial, sans-serif;
On macOS, this resolves to San Francisco (Apple's system font). On Windows, Segoe UI. On Android, Roboto. All three are excellent fonts that ship pre-installed with the operating system. They use zero network bandwidth and zero time to load.
We deleted the Google Fonts link. The site looks ~95% the same — different on Linux without a good sans-serif installed, but that's a small audience and the fallbacks degrade gracefully.
PageSpeed's "critical path latency" dropped by 1.2 seconds.
Fix 6: Inlining the bundle CSS (saves 160 ms)
The remaining render-blocking resource was the CSS bundle Vite emitted:
<link rel="stylesheet" href="/assets/index-CcF97ram.css">
5.4 KB. Took ~160 ms round-trip on a typical connection — blocking first paint.
For a CSS bundle this small, inlining it into the HTML wins over caching. The cost of inlining is that every HTML page now carries the 5.4 KB. The benefit is one fewer blocking request on first load.
Our build script (which post-processes Vite output for SSR) now reads the CSS file and substitutes a <style> block:
const cssMatch = baseHtml.match(/<link\s+rel="stylesheet"[^>]*href="([^"]+)"[^>]*>/)
if (cssMatch) {
  const cssPath = join(DIST, cssMatch[1].replace(/^\//, ''))
  const css = readFileSync(cssPath, 'utf8')
  baseHtml = baseHtml.replace(cssMatch[0], `<style>${css}</style>`)
}
Note: this is fine for our 5 KB stylesheet. If you have a 100 KB CSS bundle, inlining defeats caching across pages and you should leave it external (or extract just the critical CSS).
What we deliberately didn't fix
Google AdSense and Google Analytics gtag. Both are async scripts that PageSpeed still flags for forced reflow and high transfer size. They are 500+ ms of critical path latency between them.
But AdSense is how the site is funded. Removing it isn't an engineering trade-off; it's a business one. The same goes for Analytics — without it, we'd be flying blind on which tools are popular and which bugs nobody is hitting.
We could in principle defer AdSense to load after the LCP element is painted. We tried this for half an hour; it required overriding AdSense's own injection logic and produced visual flicker as ads loaded post-paint. Not worth the engineering complexity for ~200 ms savings.
If you're optimizing a non-ad-supported site, you have more options than we do. We had to accept that.
The results
The cold cache first-paint for https://www.toolkoala.com/ from our basic benchmark:
| Metric | Before | After | Change |
|---|---|---|---|
| Main bundle (raw) | 5,998 KB | 307 KB | -95% |
| Main bundle (gzip) | 1,755 KB | 92 KB | -95% |
| Logo PNG | 640 KB | 7 KB | -99% |
| Total JS on home | ~3 MB | 544 KB | -82% |
| Render-blocking CSS | 160 ms | 0 ms (inlined) | -100% |
| Google Fonts blocking | 1,258 ms | 0 ms | -100% |
| FCP | ~2.4 s | 256 ms | -89% |
| LCP / DOM Complete | ~2.5 s | 1,295 ms | -48% |
| Lighthouse Performance Grade | D | A (6/6 budget) | — |
The site itself is unchanged — same React components, same UI, same backend. Every fix was a configuration or build-process change.
Takeaways if you're shipping a React + Vite app
Look at your bundle output every release. It's two lines in your CI log. If anything exceeds 500 KB, investigate. Vite tells you for free.
React.lazy()plusSuspenseis the cheapest possible perf win. Route-level splitting takes ten minutes to implement and tends to save 50-90% of your main bundle.import.meta.globis Vite's superpower for lazy-loading "many files of the same kind" — locales, icons, blog posts, whatever. Use it instead of long lists of static imports.Audit transitive imports. A shared "shell" component that statically imports heavy libs will defeat all your route-level lazy-loading. The PdfToolShell bug cost us a 600 KB chunk on every page until we noticed.
Your logo is probably too big. Logos on most sites are displayed at ≤64 px. They should be ≤10 KB. Use the resize tool on this very site if you don't have ImageMagick installed.
Question every external font load. System fonts on macOS, Windows, and Android are all excellent. If your brand doesn't depend on a specific typeface (and most don't), delete the Google Fonts link entirely.
Inline tiny CSS. Under ~10 KB, the latency saved by skipping a request beats the caching benefit of an external file.
AdSense and Analytics are mostly out of your control. Accept it and optimize what you can.
This was about six hours of total engineering work spread across two days. The biggest improvements (route splitting + locale splitting) took about two hours each. The remaining four hours were measurement, regression testing, and writing this post.
If you found this useful, the tools that came out of the cleaner build are still here, still free, still running entirely in your browser:
- Image compression (yes, including your logo)
- PDF tools (the ones that triggered the lazy-loading insight)
- Video compression (FFmpeg.wasm, also lazy-loaded)
- OCR (Tesseract.js, also lazy-loaded)
- The full blog with more engineering notes
All of them load in well under a second on a normal connection. Now.
FAQ
How do you get a React app's bundle that small? Aggressive code-splitting plus lazy-loading every tool, so the main bundle only carries the app shell. Each tool's code — and its heavy wasm — loads on demand.
Does lazy-loading hurt the experience? No — the shell loads instantly, and each tool opens in well under a second on first use, then caches for next time.
What was the single biggest win? Moving the heavy engines (FFmpeg, Tesseract, the ONNX background-removal model) out of the main bundle so they load only when their tool is opened.